
The DbManager process is used in the D2000 system to work with application databases. The more a specific application is different from a classic SCADA system and the more MES functionality it contains, or the more connections it has to external systems (ERP, accounting, payroll system, attendance system, maintenance, etc.), the more important the role of application databases is. The complete extreme is ETRM (Energy Trading & Risk Management) systems, where there are essentially no standard SCADA objects (industrial communications with measured points, stations, and lines, or schemes displaying them), but the entire application is database-oriented and built on D2000 DbManager processes (working with the database) and D2000 Event Handler (scripts). In this article, we will talk about DbManager diagnostics.
History
In 2003, when I joined Ipesoft, after a few months I was given the task of converting the DbManager process from a single-threaded to a multi-threaded application. At the time, it was seen as a "bottleneck" that held back existing users of ETRM systems. The redesign was followed by a period of expansion of ETRM systems (as a result of the liberalization of the electricity market in Slovakia) and thus intensive deployment of the optimized DbManager. It was necessary to incorporate several diagnostic options and debugging support in order to be able to detect and fix not only errors in DbManager itself but also errors in the applications in which it is used - and performance problems.
Tuning options
An entire document DbManager - Tuning and Debugging, which can be found in our documentation, was created about debugging and tuning options. Here are a few examples of what is possible:
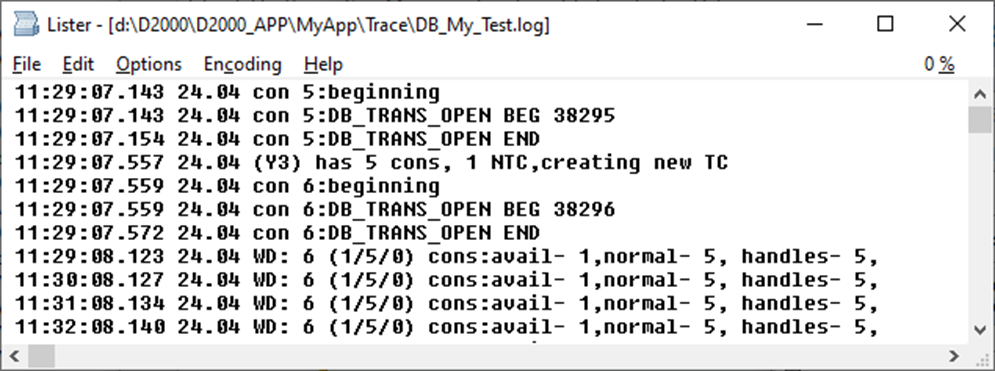
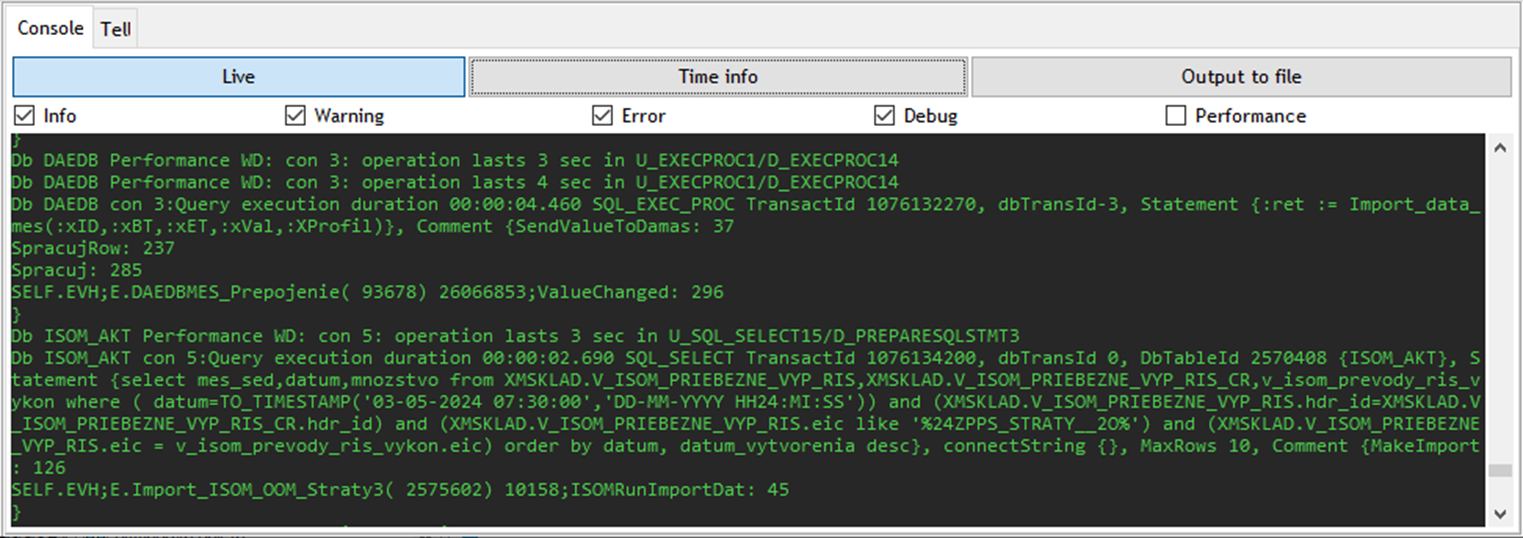
- Enable logging – on individual objects of the Database type, it is possible to enable the Debug option and specify the size of the database log file. Actions performed by all tasks that handle individual connections to the database are logged in this file. Using debugging categories DBG.DBMANAGER or DBG.DBMANAGER.DATA it is possible to enable logging of individual SQL commands and logging of written/read data. At the same time, when logging is enabled, DbManger lists the number of connections and database handles every minute (see the previous blog about the DbManager process).
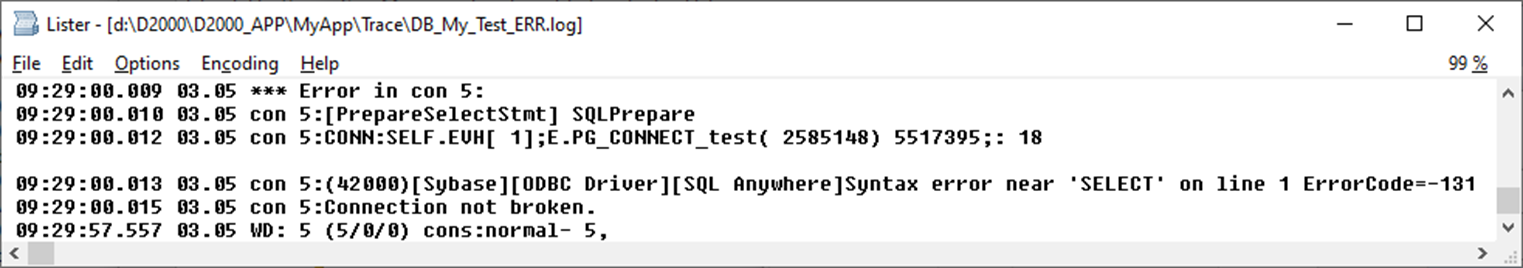
- Error logs – if an error occurs when performing a database action, the details of the error are logged in the database error log (<name_database>_ERR.log).
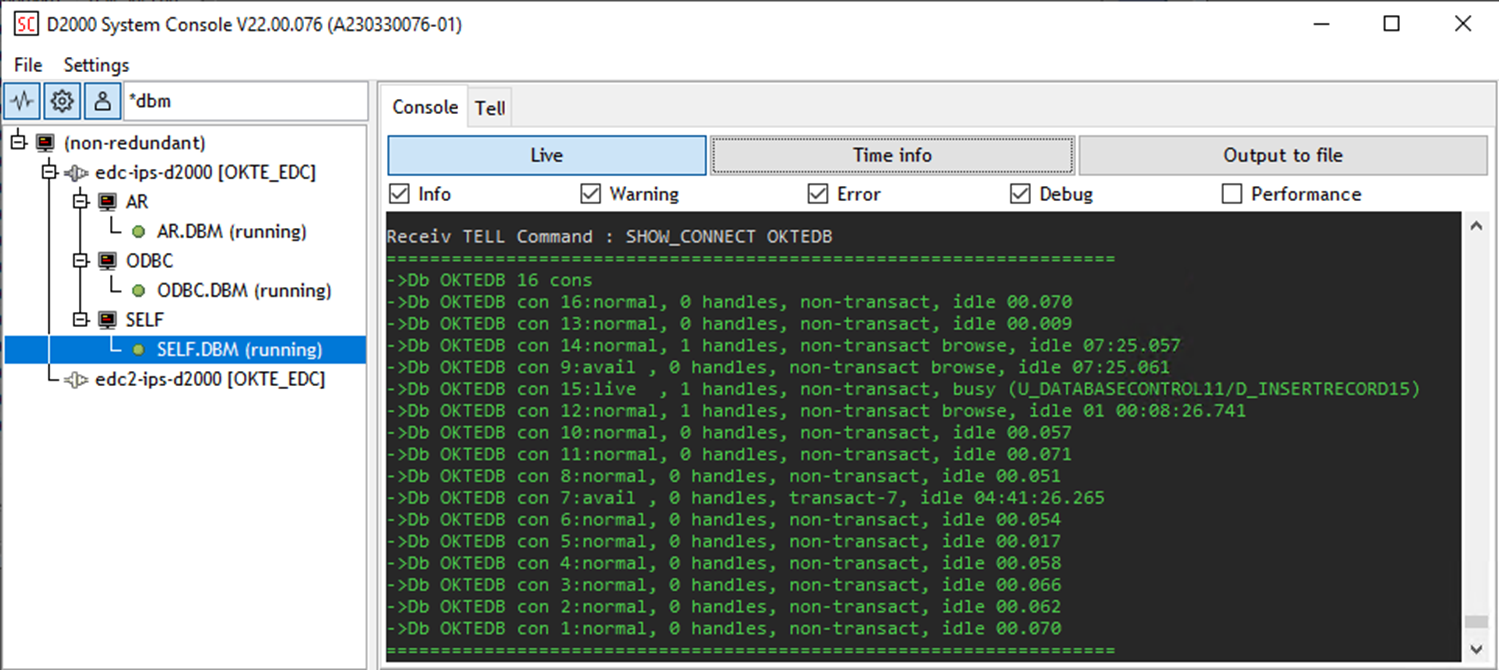
- Listing of information about databases and connections – using the SHOW_CONNECT command, it is possible to find out information about a specific DB (or several/all according to the name mask), how many connections and handles they have created, and what the status of individual connections is. These statements make it possible to reveal long-running operations, possibly "forgotten" and uncommitted transactions as well as blocked connections (due to uncommitted transactions).
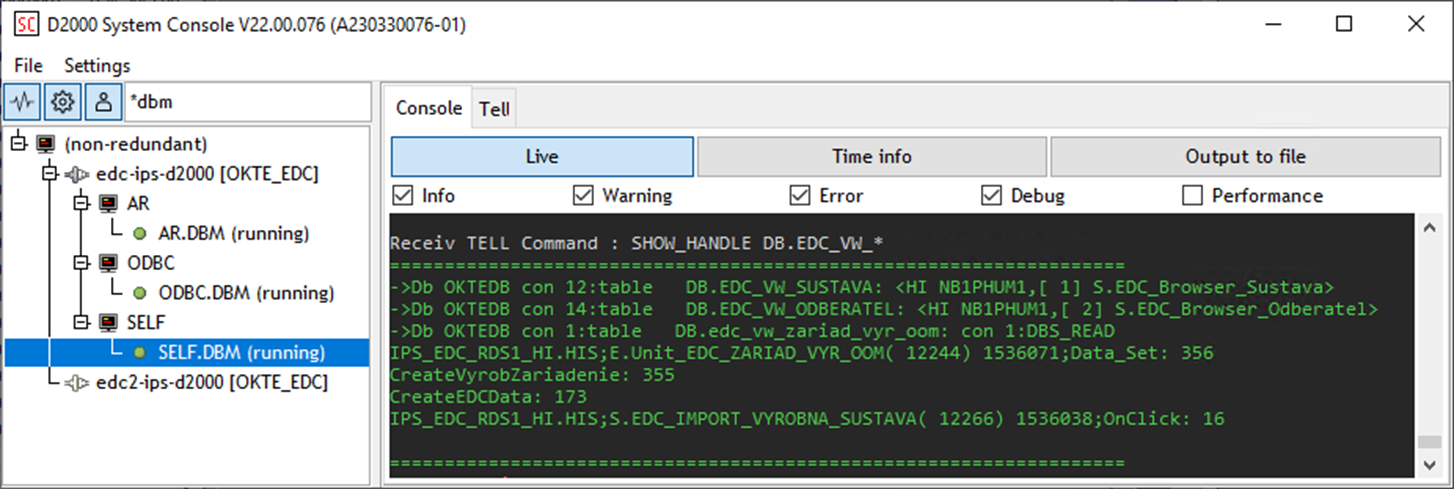
- Listing of information about handles for databases/tables – using the SHOW_HANDLE command, it is possible to find out information about open handles for a specific DB or table (or several/all according to the table name mask). These listings help to refine the details (e.g. what operations were performed within the transaction before it was blocked or "forgotten" due to the crash of the executing ESL script).
- Monitoring of long operations – using the commands SET_WATCHDOG <database_mask> <seconds> or SET_WATCHDOG_QUEUE <database_mask> <seconds> it is possible to enable the monitoring of database actions whose duration (or the duration including waiting in the queues of the DbManager process) lasted longer than the specified number of seconds. The latter of the commands is especially useful if transactions are not used, but so-called automatic connections (commit follows every database action). Automatic connections are shared between scripts/users, so if an action takes longer, it may cause another database action that uses the same database connection to wait.
- Monitoring of task queues – talking about the queues, the start parameter /DBD<number_of_requests> can be used to enable listings if the number of requests in the queue of one of the automatic (non-transactional) connections exceeds the configured limit.
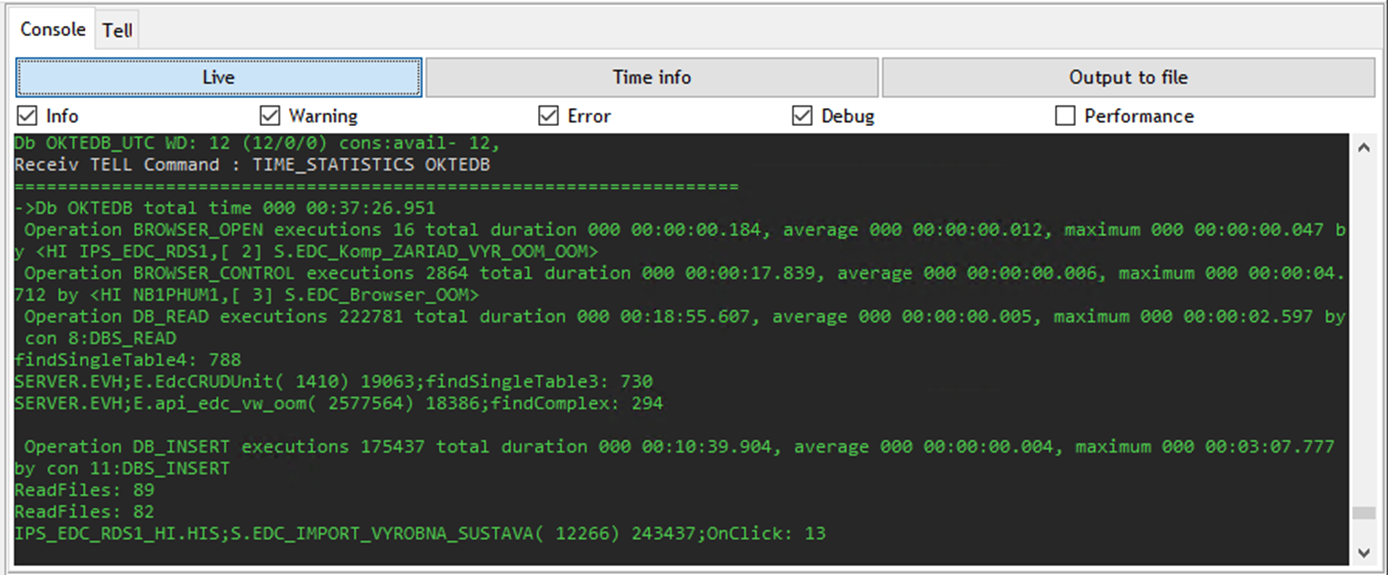
- Listing of time statistics of databases/tables – from the start, the DbManager process collects statistics on the duration and number of individual types of database actions, and it is possible to list them with the tell command TIME_STATISTICS <database_mask> [DETAIL]. For each database (or for each table, if the DETAIL parameter was specified), the number and total times of individual database actions, the duration of the longest action, and information about the script that called the action, are displayed. The following figure shows information about the operations BROWSER_OPEN (opening a table in the Browser displayer), BROWSER_CONTROL (browser paging and editing) and the DB_INSERT/DBS_INSERT actions.
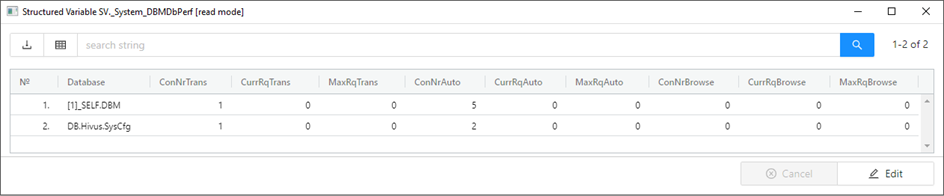
- Continuous collection of information about connections – the system structured variable SV._System_DBMDbPerf enables continuous monitoring (with a period of 10 seconds) of the number of individual types of connections (transactional, non-transactional, browser) and the number of requests in task queues handling these types of connections.
News in the current version
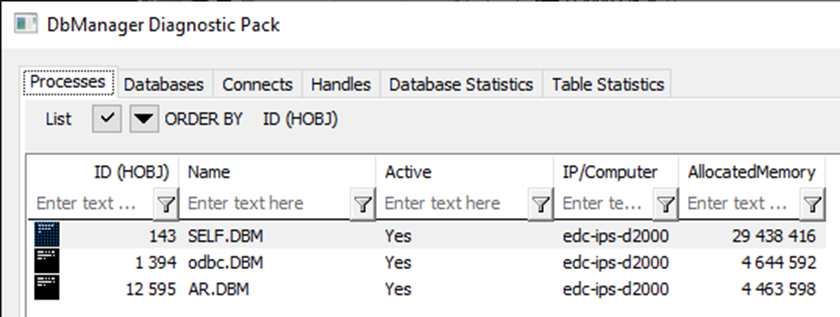
Despite the extensive debugging capabilities of the DbManager process, our users were still not satisfied. They wanted something simpler and more user-friendly than debugging with commands. That's why we've created a DbManager Diagnostic Pack which a part of D2000 version 23 (available in the D2000 Cnf and D2000 GrEditor tools menu). Following the example of the popular ESL Diagnostic Pack, it displays various types of objects and information about them on several tabs, which until now were only available via commands. It also allows filtering and sorting by individual columns and copying information (in CSV format) to the clipboard. So - what does it offer?
- Processes tab – information about DbManager processes (*.DBM) - where they run, what their memory consumption is and whether they are an active or passive instance. In addition to copying, the context menu allows you to read the statistics of the selected process about all its databases (in the Database Statistics tab) and tables (in the Table Statistics tab). These statistics (collected since the start of the DbManager process) can also be reset.
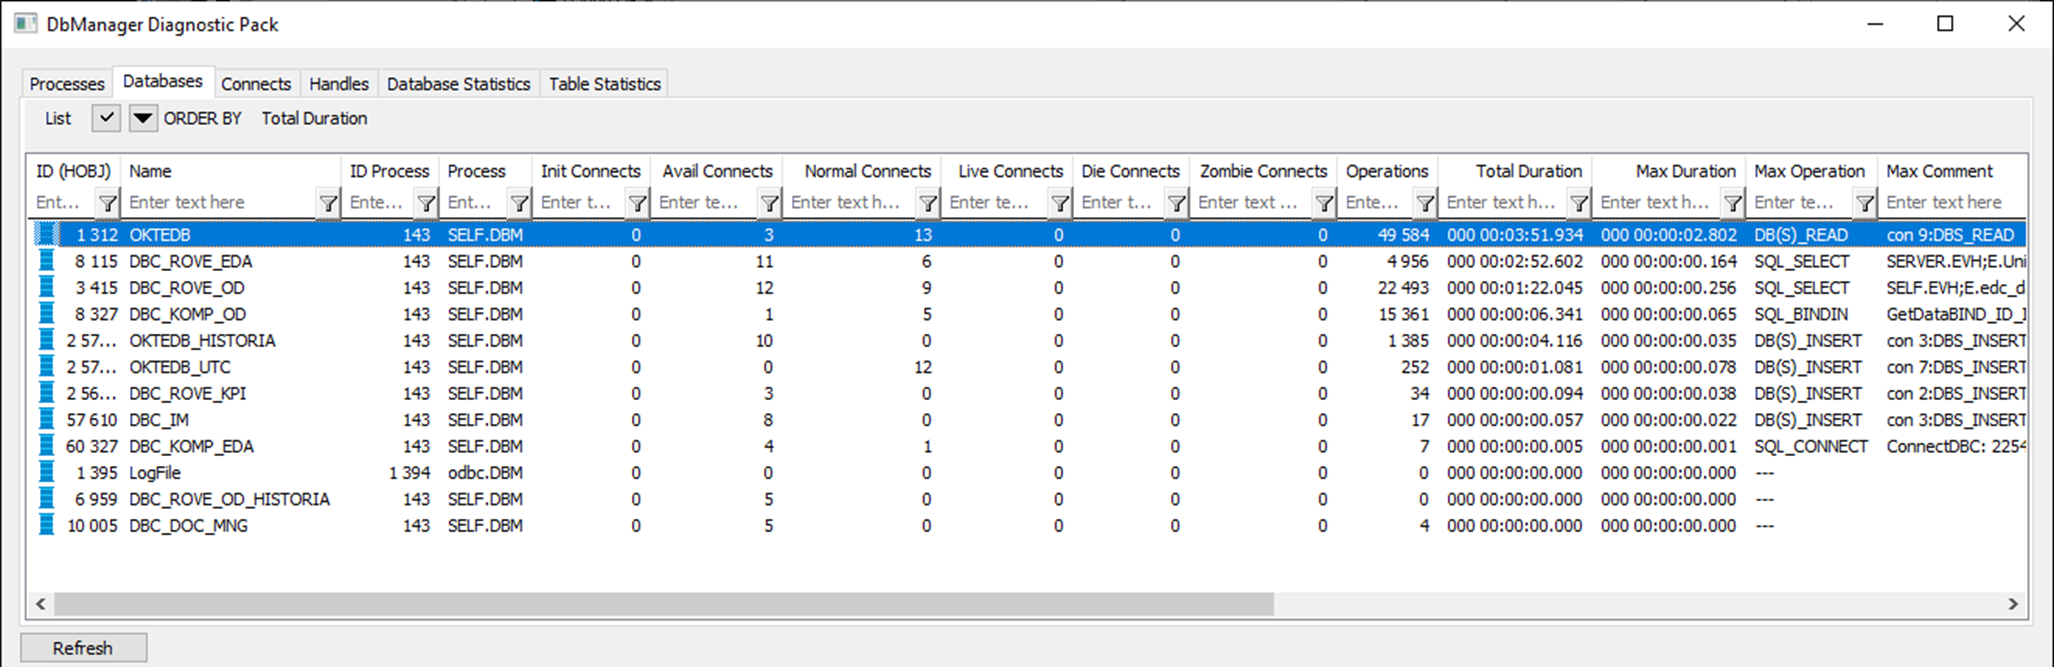
- Databases tab – information about Database objects – how many connections they have in individual states, the total duration and number of database operations and information about the longest database operation. The context menu allows you to read statistics about the selected database (in the Database Statistics tab) and about the tables belonging to this database (in the Table Statistics tab). These statistics (collected since the start of the process) can also be reset.
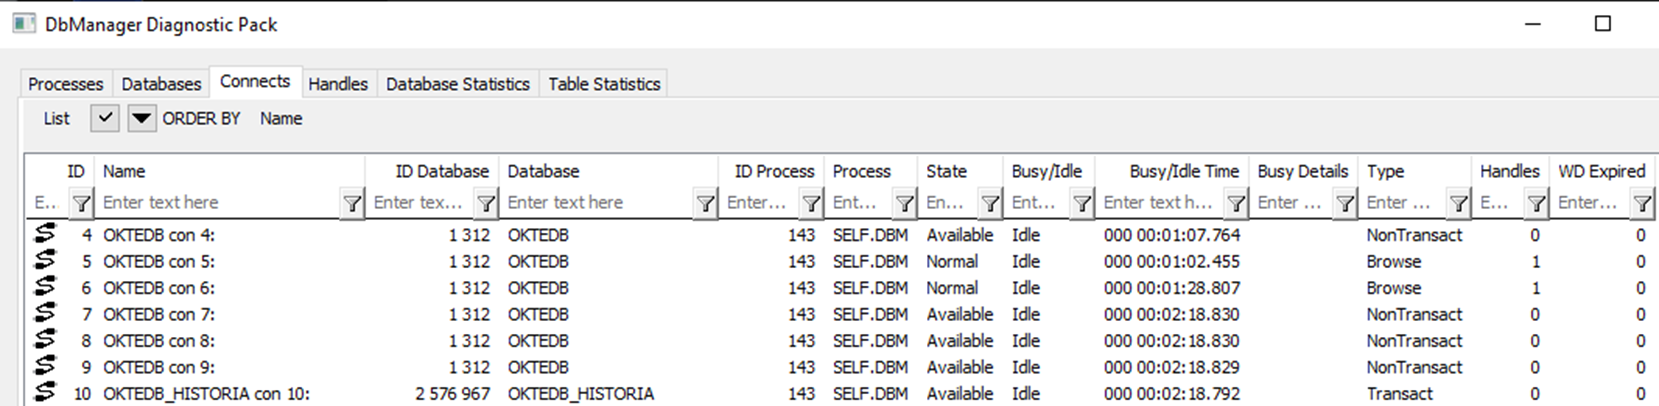
- Connects tab – information about connections to the database – what state they are in (busy/idle) and how long, what type they are (transactional, non-transactional, browser) and how many descriptors they have open.
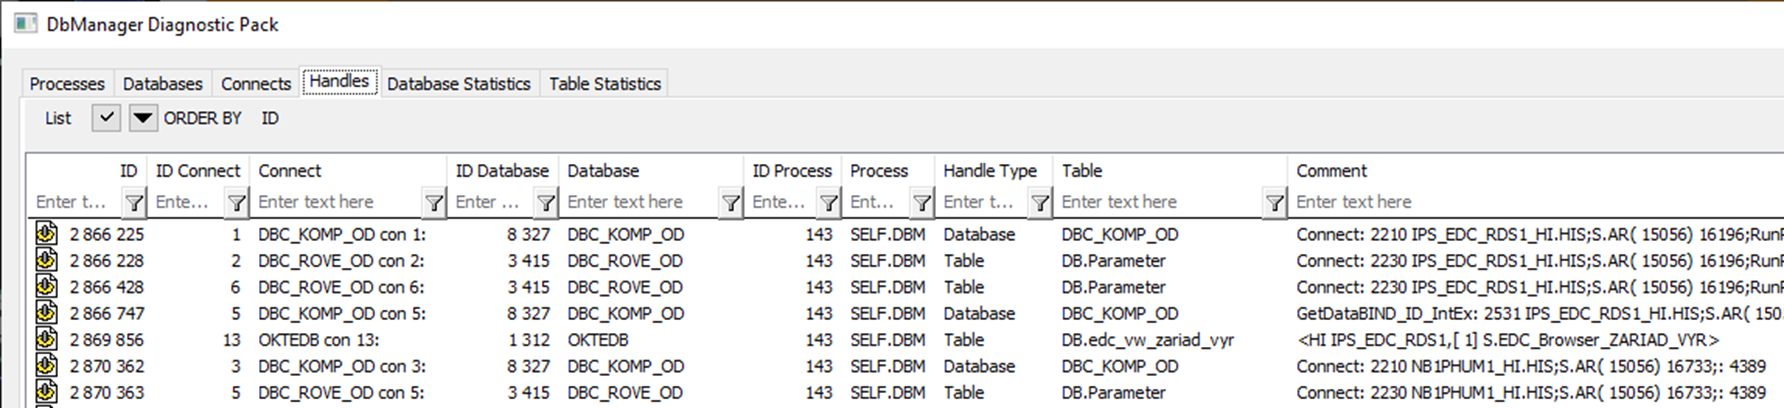
- Handles tab – information about open handles – what type they are, or to which Database/Table object they are bound and information about the script that created the handle.
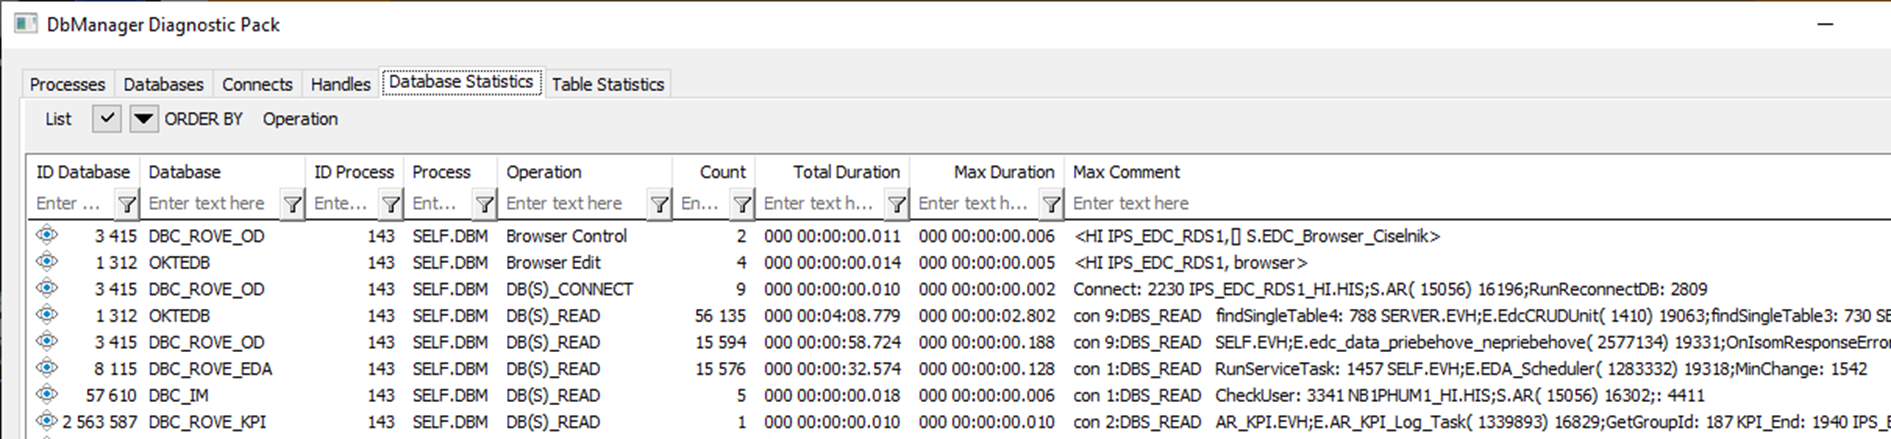
- Database Statistics tab – statistics of individual databases. For each database and type of database action, there is information about the number of executions, their total and maximum duration, and information about the script that initiated the longest action.
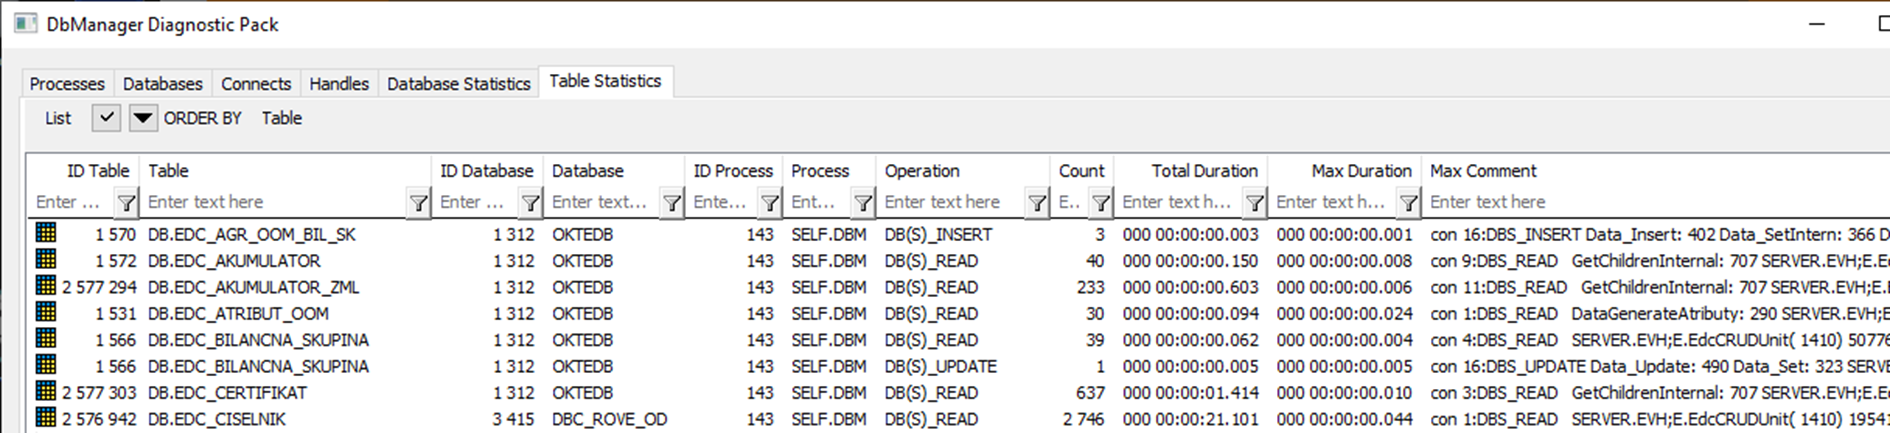
- Table Statistics tab – statistics of individual tables. For each table and type of database action, there is information about the number of executions, the total and maximum duration, and information about the script that initiated the longest action. The context menu allows reading or resetting statistics on the selected table.
Similar to the ESL Diagnostic Pack, there is a Refresh button that re-reads the current information.
One interesting thing - DbManager Diagnostic Pack can be started not only from the main menu, but also from the context menu Extended actions on objects of Database and Table types. In this case, only information about the specific Database, its parent DbManager process and the tables whose parent is the selected Database will be displayed.
DbManager Diagnostic Pack is a brand new tool in the D2000 system and I believe that it will please all users who work with databases in D2000. To accommodate colleagues, OEM partners and customers, the DbManager Diagnostic Pack has been back-ported to these existing releases, for which new DbManger and Cnf processes have been generated:
- D2000 V21 release 73
- D2000 V22 release 74
- D2000 V22 release 76
- D2000 V23 release 78
Conclusion
The D2000 DbManager process, used to perform database actions within the Ipesoft D2000 real-time application server, offers extensive options for debugging, diagnostics and performance optimization when working with databases. The recently developed DbManager Diagnostic Packimplements a user-friendly interface accessible directly from the D2000 Cnf and D2000 GrEdit tools and speeds up debugging and searching for performance problems in applications built on Ipesoft D2000 technology.
May 6, 2024, Ing. Peter Humaj, www.ipesoft.com
