How can I find out what takes the longest in my D2000 ESL script and where its bottlenecks are? Today's blog will guide you through the basics of what is also called profiling in software terminology.
The D2000 Event process is a part of the Ipesoft D2000 real-time application server since early versions. This process is responsible for executing scripts in the ESL (Event Script Language). ESL scripts, which are an optional part of the schemes, are interpreted by the dynamic library (event.dll) used by the D2000 HI process.
ESL is a scripting language developed specifically for the needs of D2000. On the one hand, this is an advantage - over the years, various actions and functions have been added, e.g. support for working with databases, synchronous/asynchronous procedure calling (RPC CALL) within the same or remote D2000 Event process, JSON and XML parsing, working with archive data, instance ESL scripts, UNITs (libraries) and others. On the other hand, a disadvantage - unlike, for example, Visual Basic, various 3rd party function libraries are not available (which was one of the reasons why Java support was added to D2000).
A development and debugging environment was created for ESL, the older version of which used the Scintilla editing component.
Later (from D2000 version 12) we switched to the editor based on Visual Studio Code, to which new features and various improvements are still being added today.
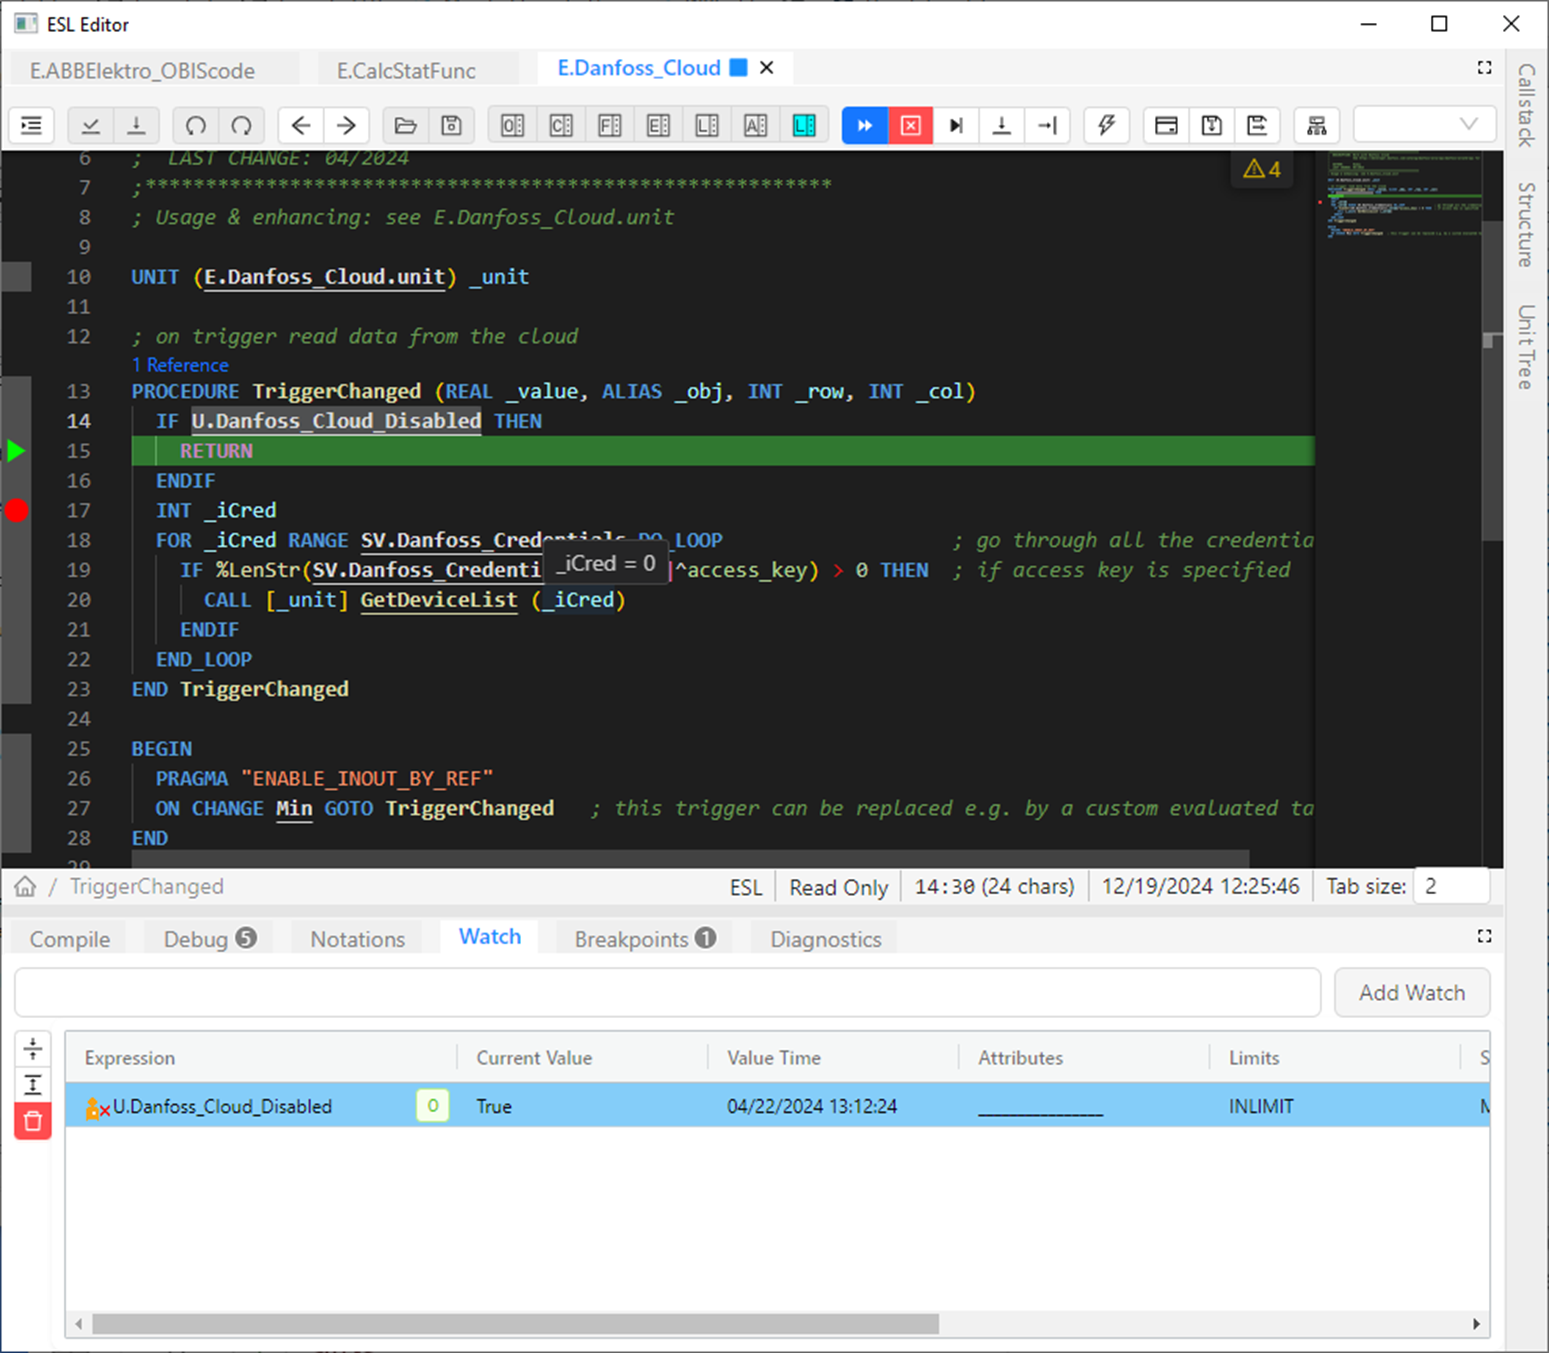
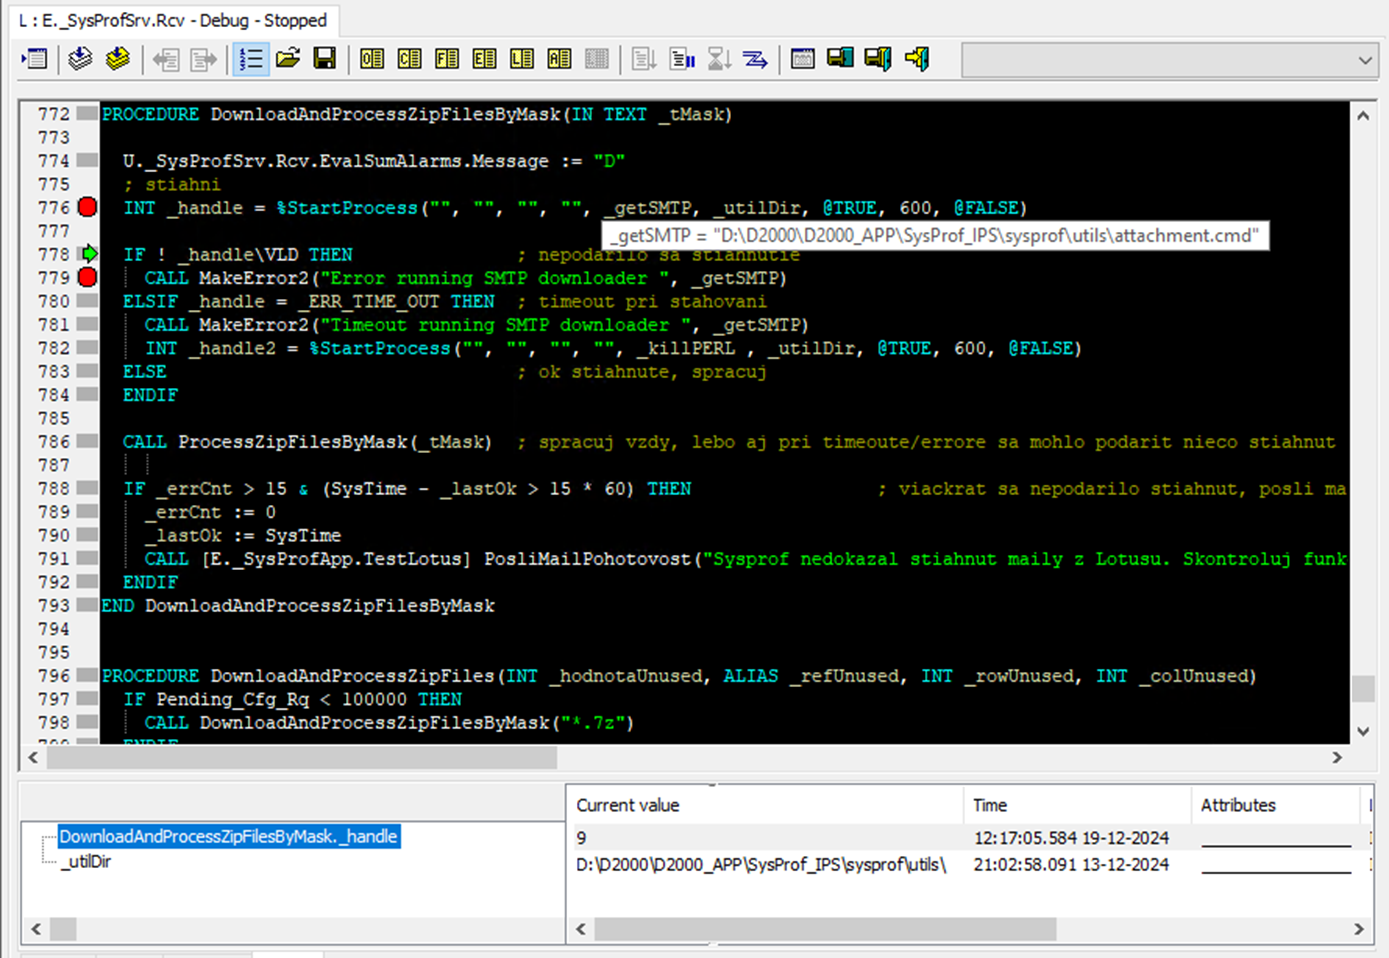
Users can connect to scripts and debug them regardless of whether they are local D2000 Event processes or scripts are run in the context of a remote process (or as part of a schema in D2000 HI for a specific user).
But what if I don't want to debug a specific script run, but want to get information, for example, about memory consumption or other system resources - e.g. open file handles, the number/size of containers or the number of open databases/tables?
Or the answer to a very specific and difficult question of many D2000 users - why is my script slow and what takes the longest time?
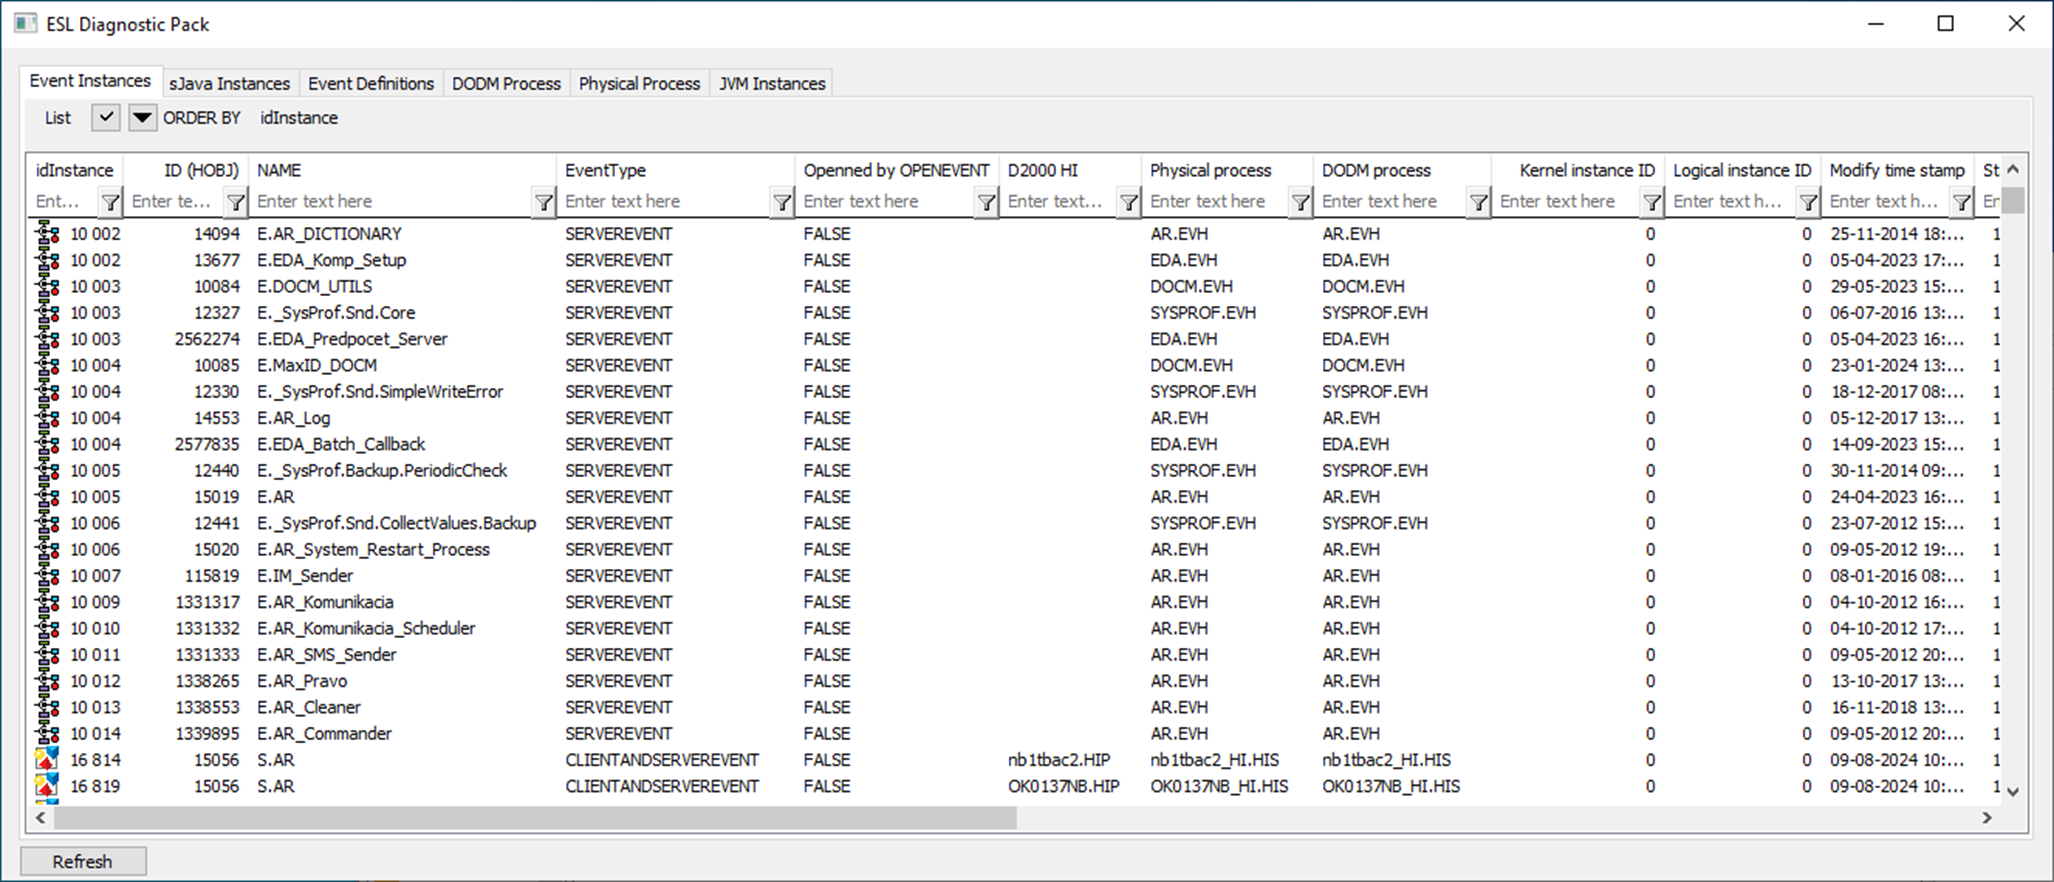
Such and similar questions led my colleague Boris to implement the ESL Diagnostic Pack. It is part of the D2000 Cnf and D2000 GrEditor tools.
Basically, it is one large window, into which, when opened, information about all ESL scripts in the D2000 application is poured. Individual columns can be filtered and sorted (if that's not enough, the contents of the window can be copied to the Windows clipboard and transferred to, for example, Excel for more detailed analysis). What information is displayed about each script?
- The name of the process on which it is running (+ the name of the physical process, which in the case of instance processes also includes the instance number).
- Information about the ESL script's state (executing/waiting) and the currently executing line.
- The number of data containers and the amount of memory they use.
- The total size of the script's local variables (including local structured variables).
- The number of open database connections and tables.
- The number of open files, JSON and XML objects.
- The number of requests in the ESL script's queue waiting to be served (changes to the values of objects that the script is waiting for + RPC calls).
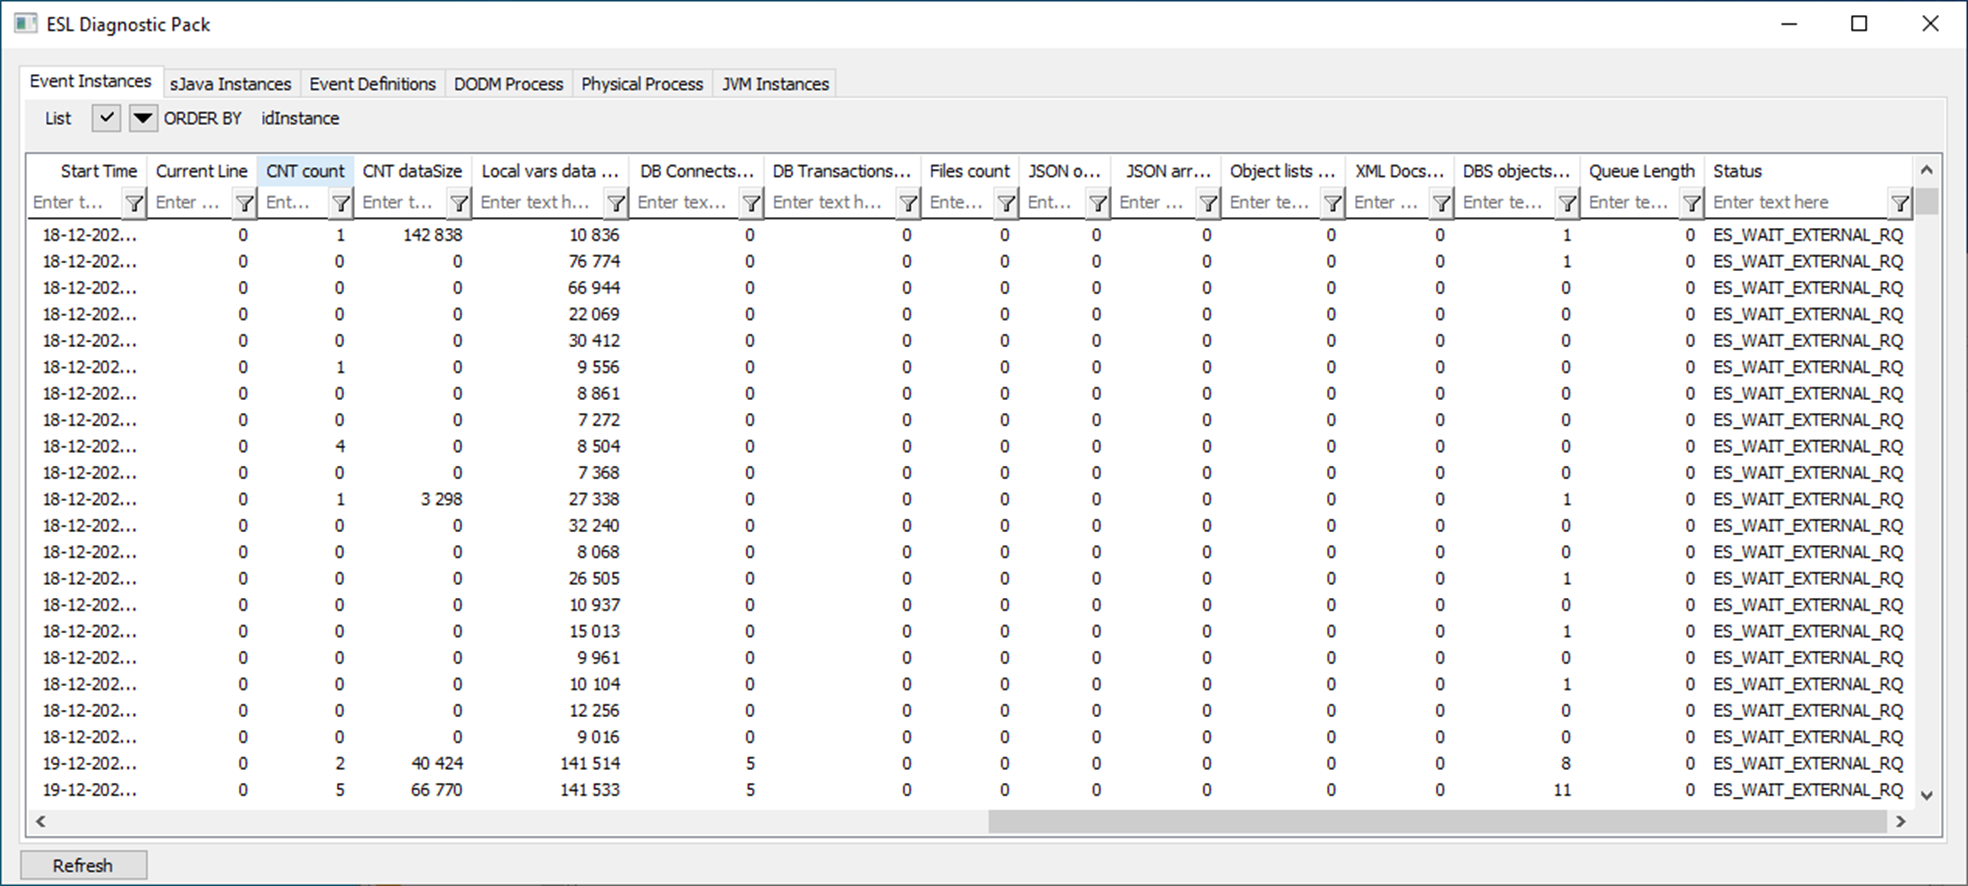
This information is useful and allows you to easily diagnose various "leaks" - unclosed connections/files, XML or JSON documents, or allocated containers. Just sort the list in descending order by selected columns and see if there are any unexpectedly high values in the upper rows.
The Refresh button is used to reload current information about all ESL scripts, so you can monitor changing values in real time.
If you want to focus on a specific script, you can double-click on a single row to find out more detailed information about it:
- For individual containers, the current/maximum number of items and the current size.
- For individual database transactions, the number of "IN" and "OUT" actions (read/write data) and the total volume of data transferred in both directions.
- For individual database tables, the number of "IN" and "OUT" actions (read/write data) and the total volume of data transferred in both directions.
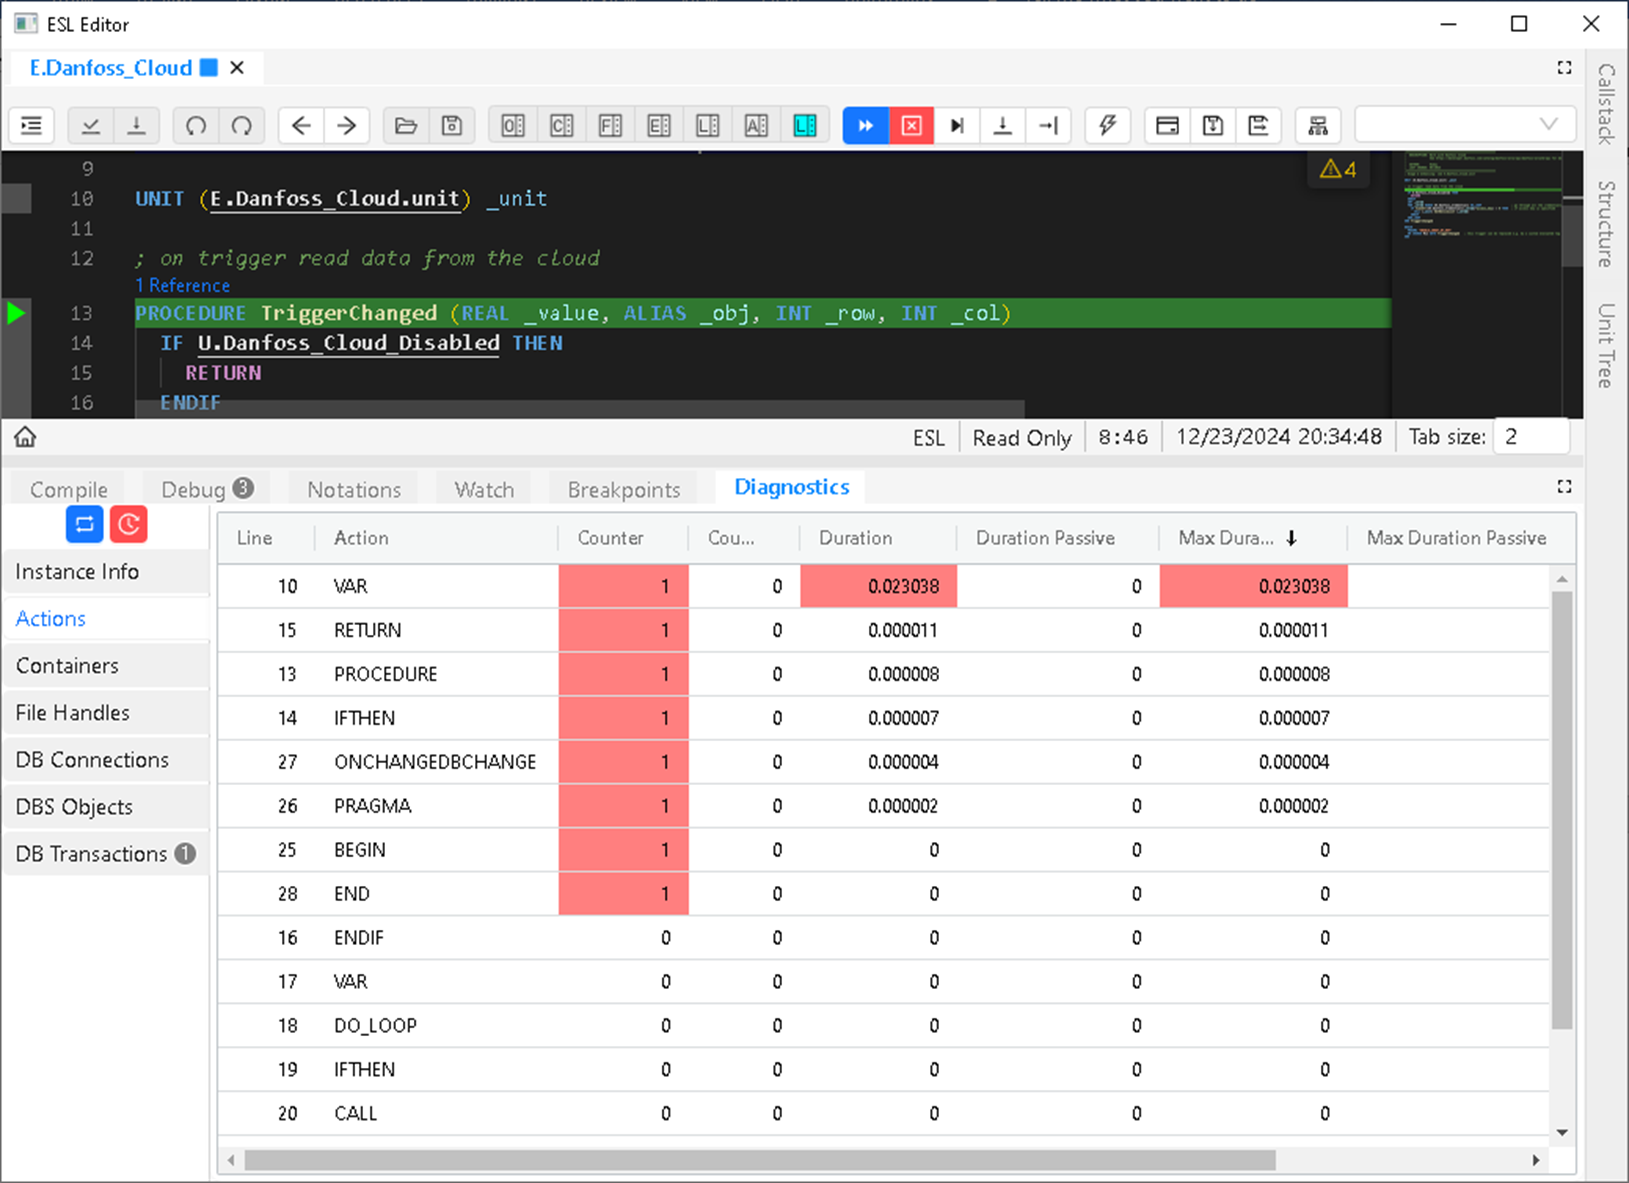
- For individual lines in the script, statistics on the number of executions, the total and maximum active duration of the action (e.g. working with a container), the passive duration of the action (e.g. waiting for D2000 DbManager or D2000 Archive).
- For used UNITs (libraries), all of the above data, including information about the UNITs used by them.
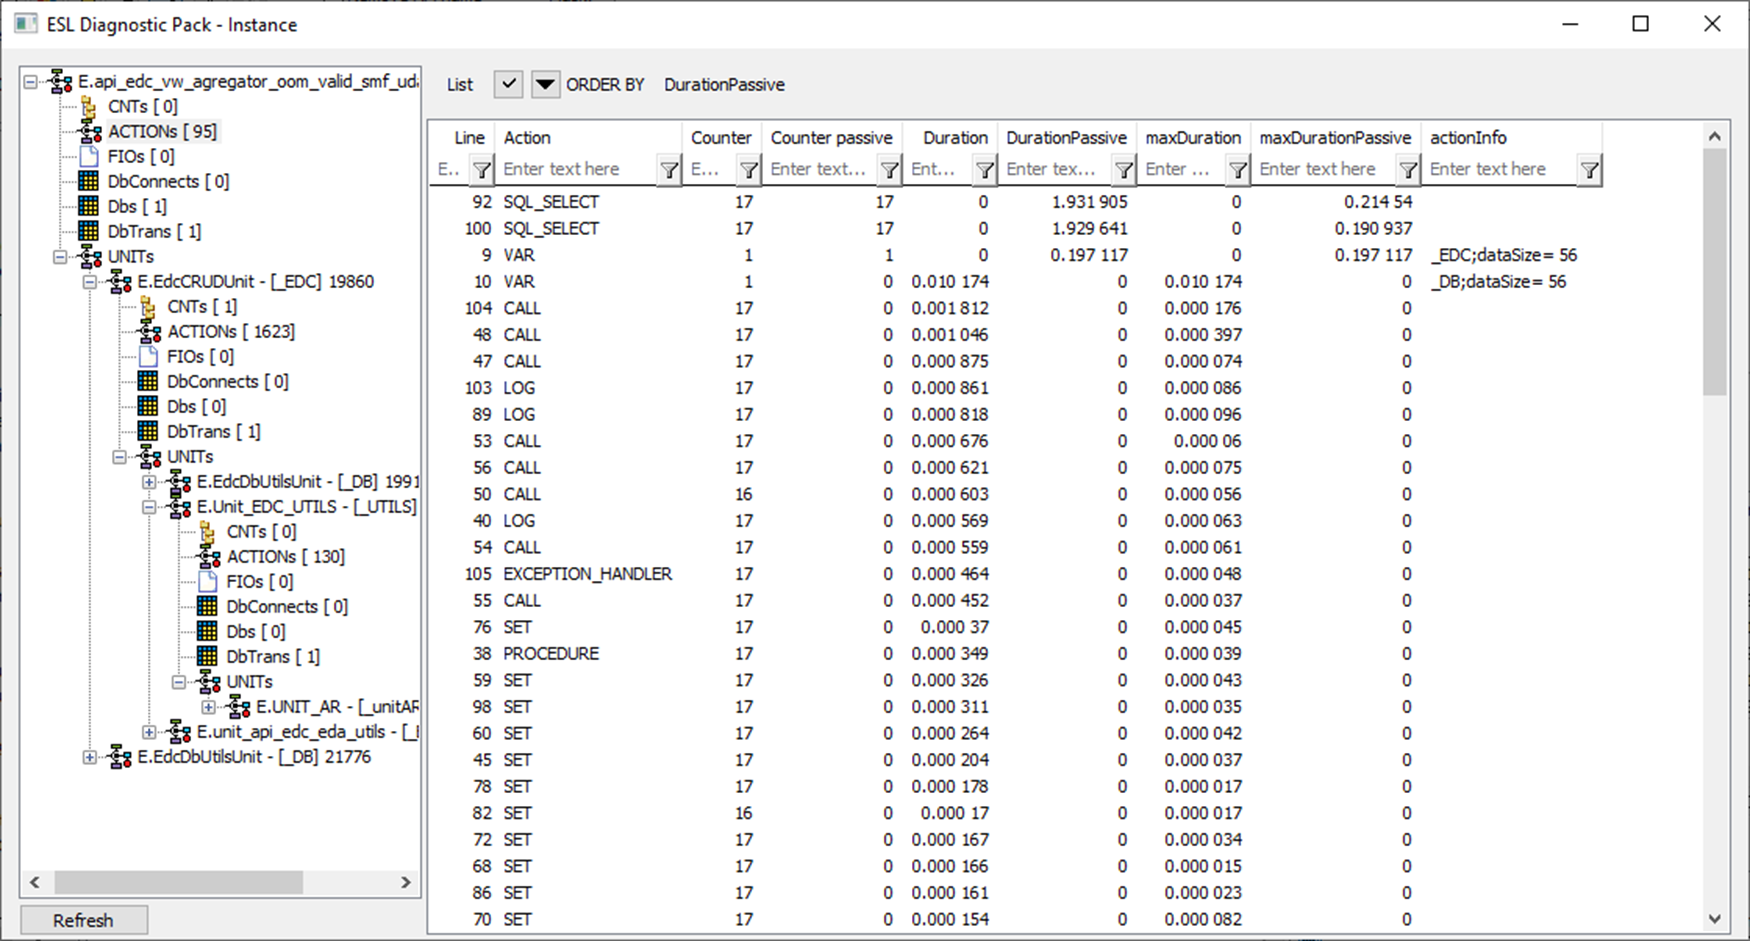
Again, detailed information can be copied, for example, to Excel and further analyzed there. But mostly it is enough (if it concerns the slowness of the script and the search for critical points) to sort the actions by the columns Duration and DurationPassive (total active/passive duration of the action), or maxDuration and maxDurationPassive (longest active/passive duration of the action) and focus on the actions that individually or collectively take the most time.
Conclusion
ESL Diagnostic Pack is a very useful tool for tuning the performance and correctness of ESL scripts. This blog certainly does not aim to provide exhaustive information about all its options (that is what the documentation is for), but only wants to inform that the Ipesoft D2000 real-time application server has been offering such options for several years - to all its users and without the need to additionally license this useful functionality.
December 19, 2024, Ing. Peter Humaj, www.ipesoft.com
PS: Remember when I wrote above that the ESL editor is constantly evolving? So, when I talked to its developer after writing this blog, I learned that the window with detailed script information provided by the ESL Diagnostic Pack is integrated directly into the ESL editor in the latest version of D2000, and after connecting to the ESL script, you can view this information on the Diagnostics tab: